Agent quality over time¶
How did working with coding agents change over six months? We didn't run a benchmark. We measured the researcher's own messages to the agent: about 2,000 of them, from April to October 2026, across six Claude models. A small model (Haiku) labelled each message as a correction ("that's wrong, undo it"), a challenge ("are you sure? why not just…?"), praise, an instruction or other. It also gave each one a 1–5 satisfaction score and flagged whether the message implied the agent had made a mistake.
Pushback means corrections plus challenges: how often the researcher had to steer against what the agent had just done.
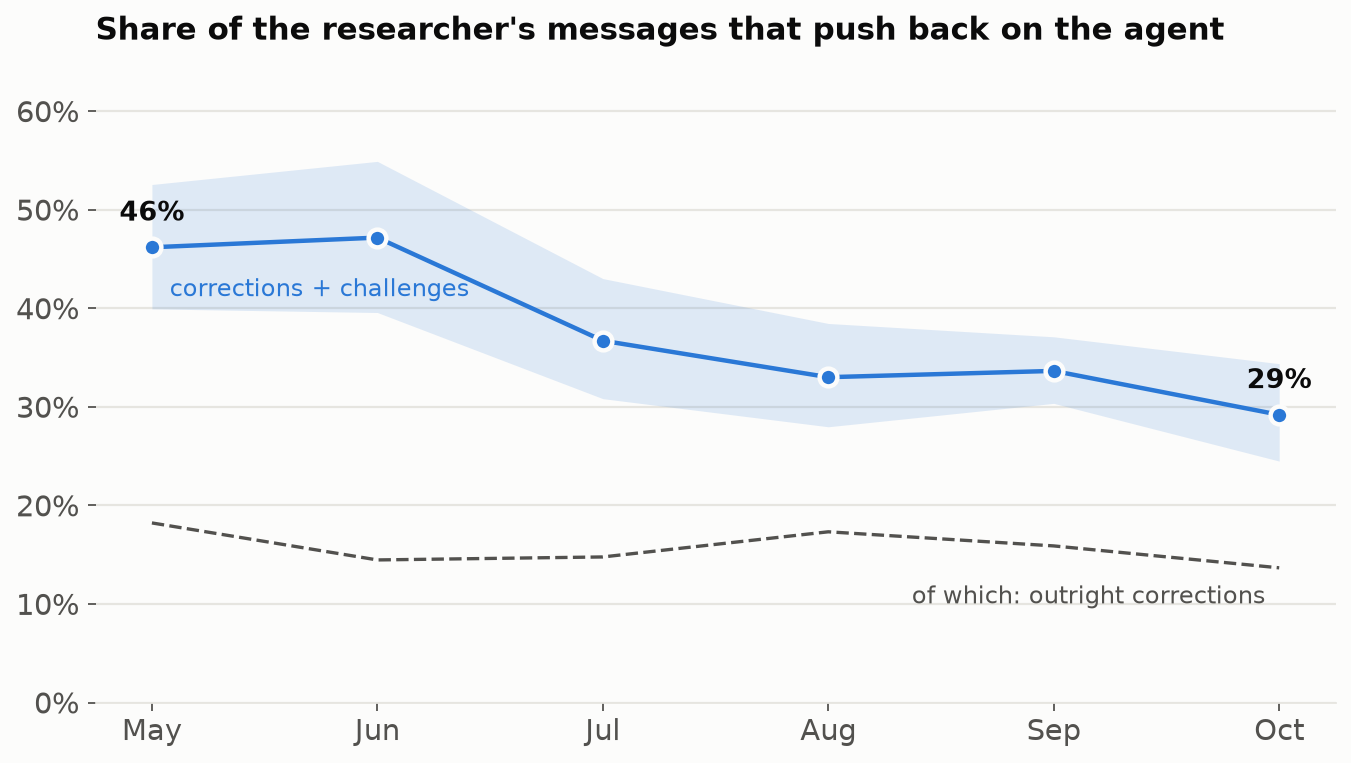
- Pushback fell from 46% to 29%. Almost all of the fall is in challenges. The researcher asked "are you sure?" about half as often by October.
- Outright corrections stayed flat at about 15%. Roughly one message in seven still says "that's wrong".
Four measures, month by month¶
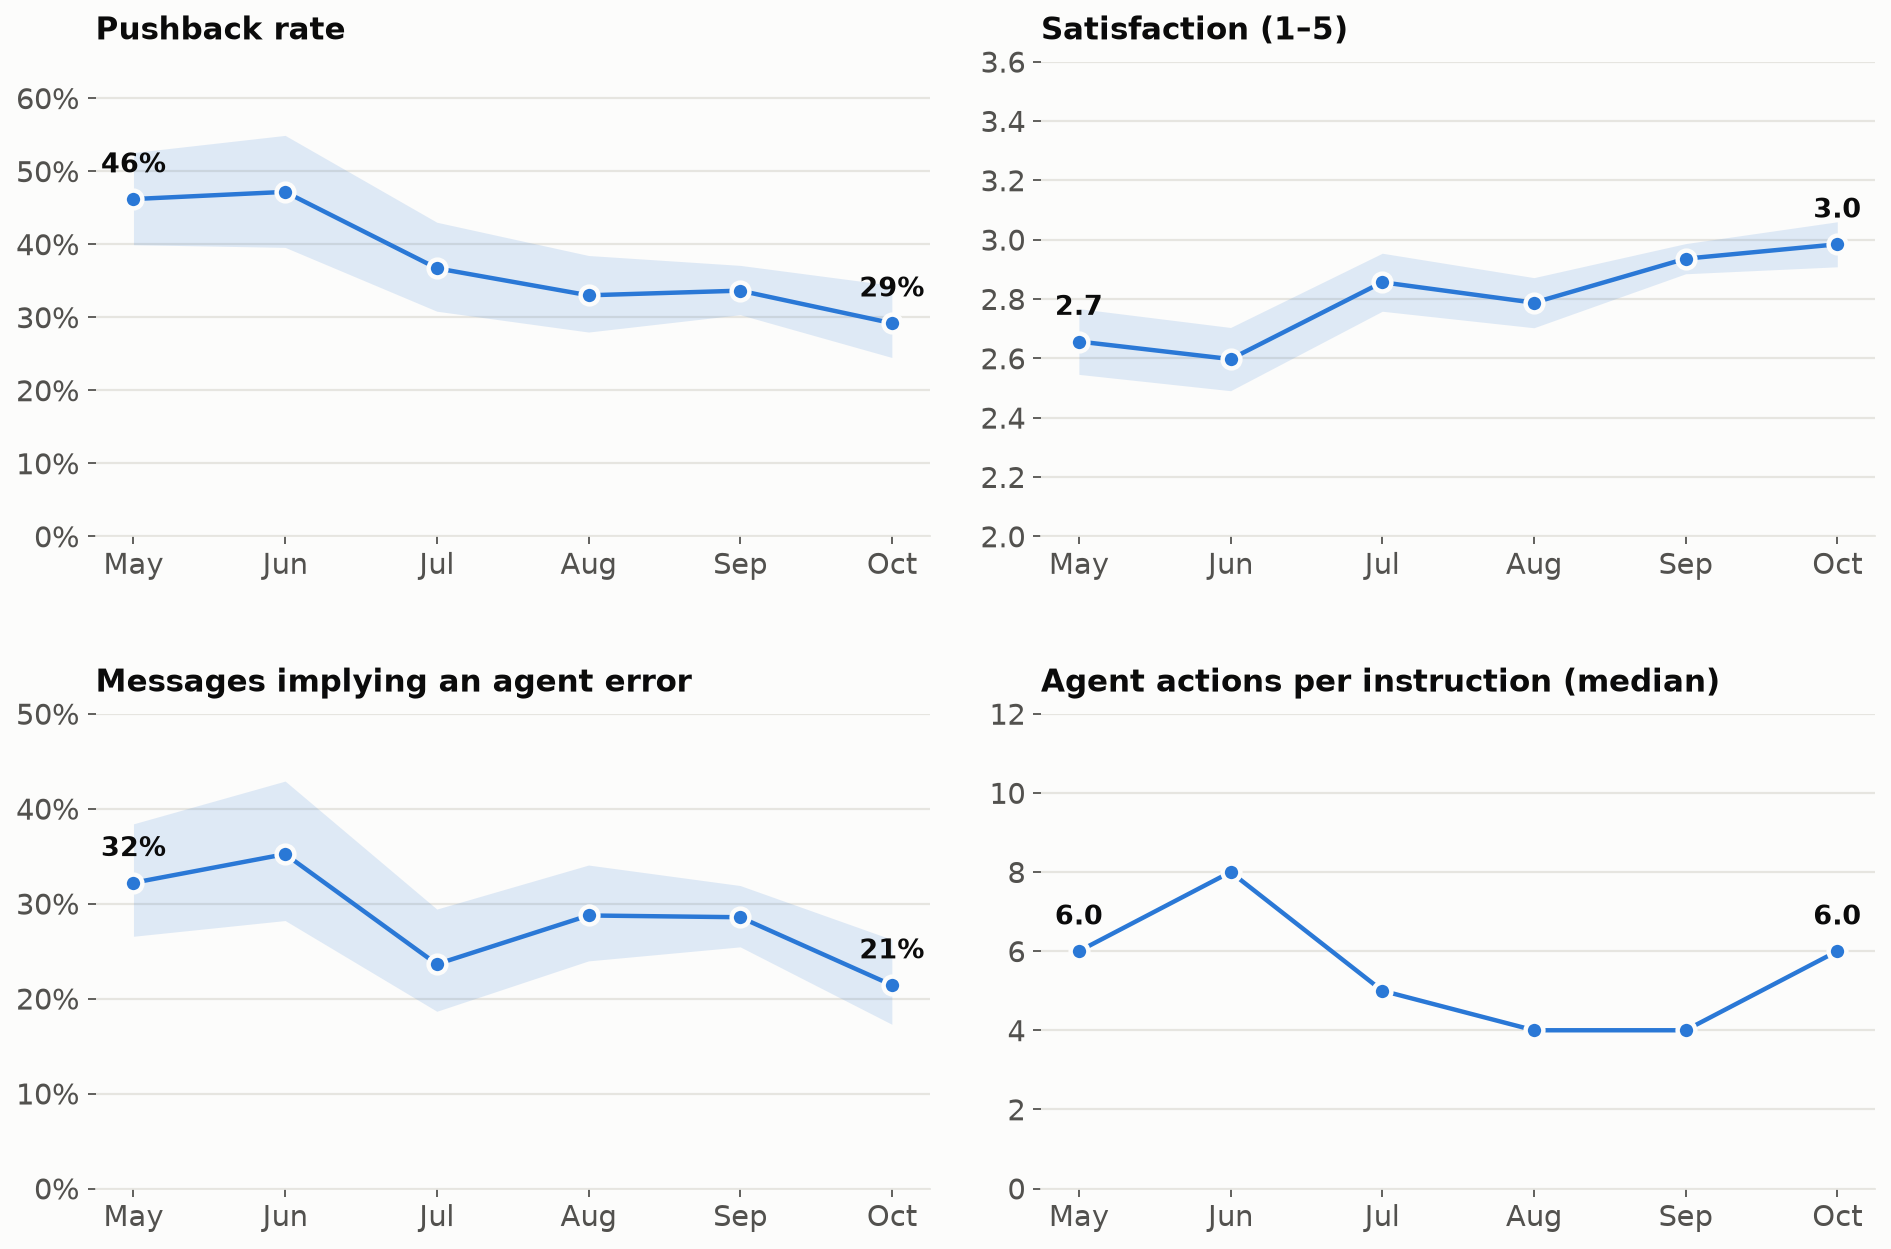
- Satisfaction rose from about 2.7 to 3.0 out of 5. That's from slightly unhappy to neutral; it isn't delight.
- Messages implying an agent error fell from about a third to about a fifth.
- Agent actions per instruction stayed flat: the agent does about 4–8 things per message. More of the work moved into background jobs and shorter, more numerous threads, which these numbers don't capture.
By model¶
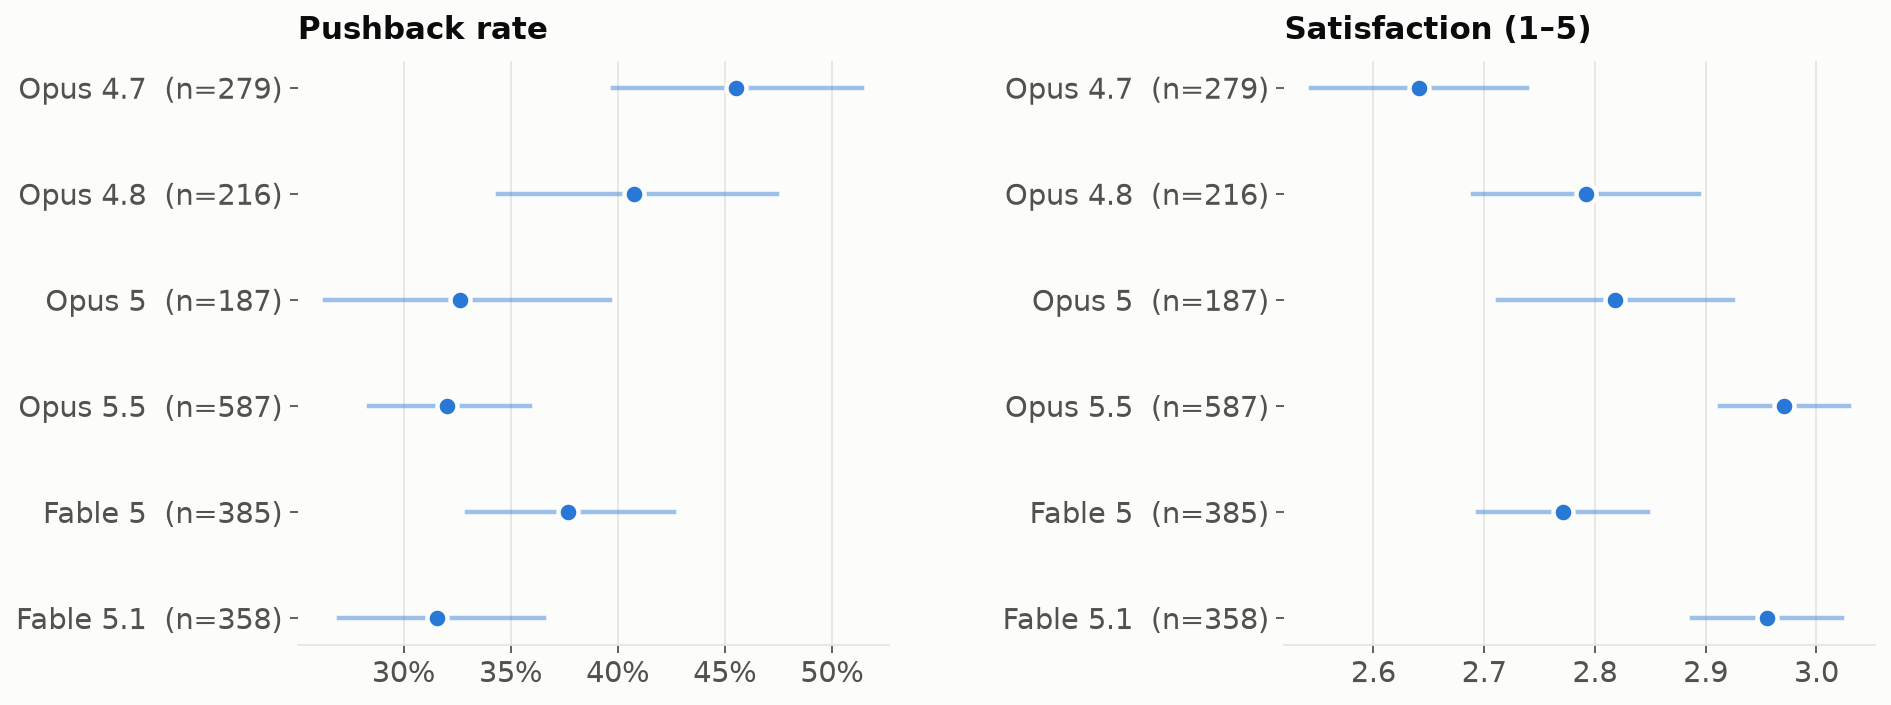
This is not a model ranking
Each model was used in different months, on different projects, by a researcher who was getting better at working with agents. The ordering mostly follows the calendar. Read this as how working practice changed, not as a controlled comparison.
The numbers¶
| Month | Messages | Pushback | Corrections | Challenges | Agent error | Satisfaction | Actions / instruction |
|---|---|---|---|---|---|---|---|
| 2026-04 † | 6 | 67% | 17% | 50% | 17% | 2.50 | 6 |
| 2026-05 | 236 | 46% | 18% | 28% | 32% | 2.66 | 6 |
| 2026-06 | 159 | 47% | 14% | 33% | 35% | 2.60 | 8 |
| 2026-07 | 237 | 37% | 15% | 22% | 24% | 2.86 | 5 |
| 2026-08 | 306 | 33% | 17% | 16% | 29% | 2.79 | 4 |
| 2026-09 | 749 | 34% | 16% | 18% | 29% | 2.94 | 4 |
| 2026-10 | 322 | 29% | 14% | 16% | 21% | 2.98 | 6 |
† fewer than 30 messages; not plotted.
| Model | Messages | Pushback | Agent error | Satisfaction |
|---|---|---|---|---|
| Opus 4.7 | 279 | 46% | 31% | 2.64 |
| Opus 4.8 | 216 | 41% | 29% | 2.79 |
| Opus 5 | 187 | 33% | 27% | 2.82 |
| Opus 5.5 | 587 | 32% | 26% | 2.97 |
| Fable 5 | 385 | 38% | 30% | 2.77 |
| Fable 5.1 | 358 | 32% | 26% | 2.96 |
Bands and whiskers are 95% intervals (Wilson for rates). Satisfaction is a 1–5 scale where 3 is neutral.
How much to trust the labels¶
The labeller is a cheap model, so we checked it. A larger model (Sonnet) independently labelled 150 messages:
| Agreement | Value |
|---|---|
| Message type (correction / challenge / …), κ | 0.65 |
| Pushback yes/no | 89% |
| Satisfaction, Spearman ρ | 0.74 (mean difference 0.25) |
| Agent error yes/no | 88% |
That's good enough for trends across hundreds of messages, not for judging single messages. Praise is too rare to measure reliably.
An earlier attempt used keyword matching ("no", "wrong", "thanks"…). It missed about 80% of corrections, because this researcher mostly corrects by asking questions. See methodology for the full pipeline and its limits.